As Bandas de Bollinger é um indicador de negociação criado por John Bollinger e que consiste em 3 linhas e pode ajudar o trader a:
- Identificar áreas potenciais de sobrecompra / sobrevenda
- Identificar a volatilidade dos mercados
Agora você provavelmente está se perguntando: “O que as três linhas significam?” As tres linhas reprentam as bandas superior, a média móvel e a banda inferior. Neste artigo usarei as configurações padrão para bandas de Bollinger, que são a média móvel de 20 períodos e 2 desvios padrão para as bandas superior e inferior.
- Banda superior – banda média mais 2 desvios padrão
- Banda inferior – banda média menos 2 desvios padrão
- Banda média – média móvel de 20 períodos

So, what is standard deviation?
Well, it basically measures how far you’re away from the average.
If you want to learn more, go study this lesson on standard deviation.
So in other words…
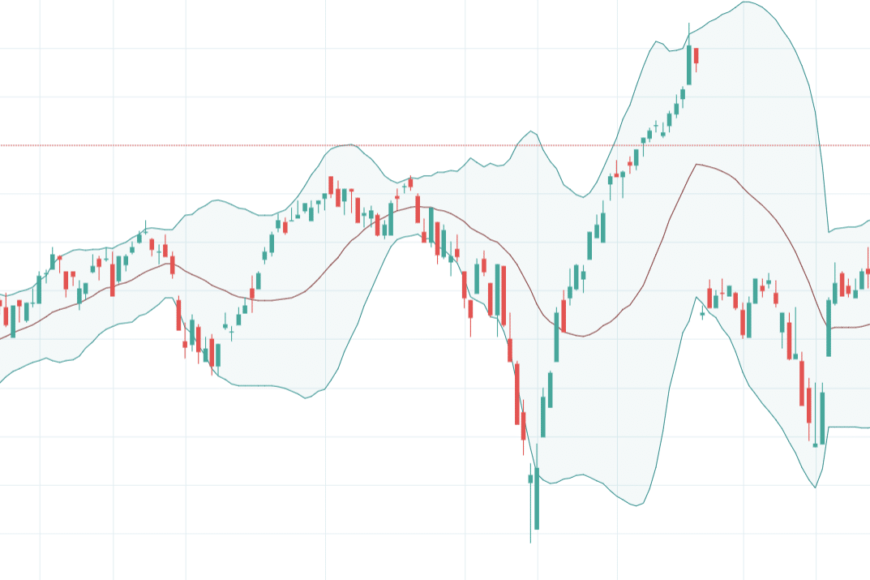
If the price is near the upper Bollinger Band, it’s considered “expensive” because it is 2 standard deviation above the average (the 20-period moving average).
And if the is price near the lower Bollinger Band, it’s considered “cheap” because it’s 2 standard deviation below the average.
Here’s an example:
Do not make this MISTAKE when trading Bollinger Bands
Now…
Just because the price seems “cheap” or “expensive” doesn’t mean you enter a trade immediately.
Because in trending markets, the market can remain “cheap” or “expensive” for a long period of time.
Here’s an example: EUR/USD remained “expensive” for many months…
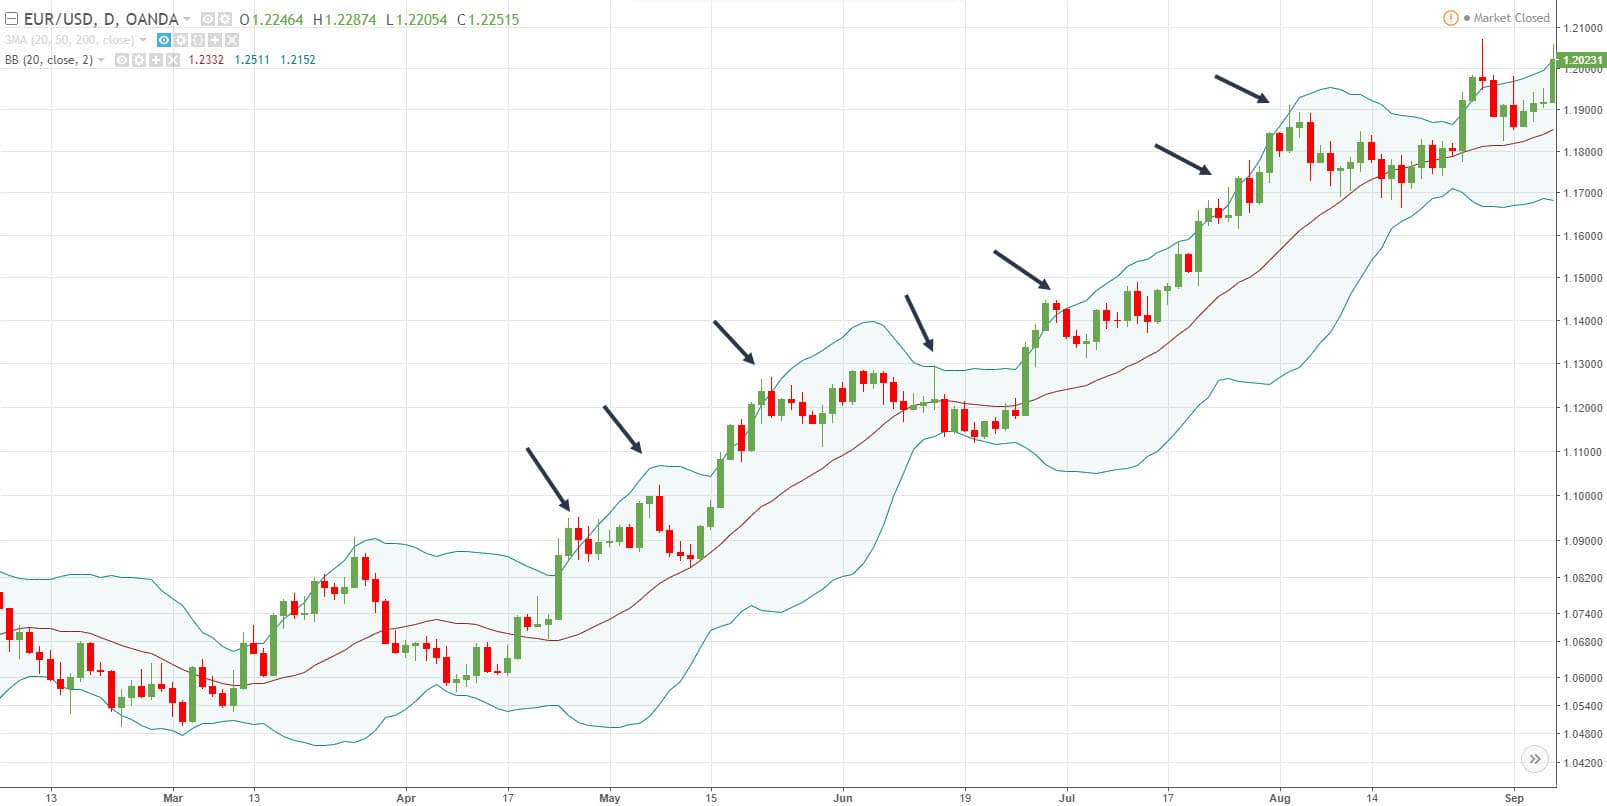
As you can see, it’s a painful thing to do if you blindly shorted when the price is at the upper bands.
So what should you do?
Read on…
Bollinger Bands trading strategy: How to buy low and sell high
You’ve probably heard this a gazillion times.
If you want to make money in the markets, just buy low and sell high.
But the question is… HOW?
Well, you can do so with Bollinger Bands (duh).
Recall:
The outer Bollinger Bands are 2 standard deviations away from the mean.
This means if the price is in the lower band, it’s considered “cheap”. And if it’s in the upper band, it’s considered “expensive”.
But before you think…
“Great! I’ll just go long when the price reaches the lower band.”
Not so fast my young Padawan.
If you want to have a higher probability of success, then you’ll need a few confluence factors coming together before you trade the bands.
For example:
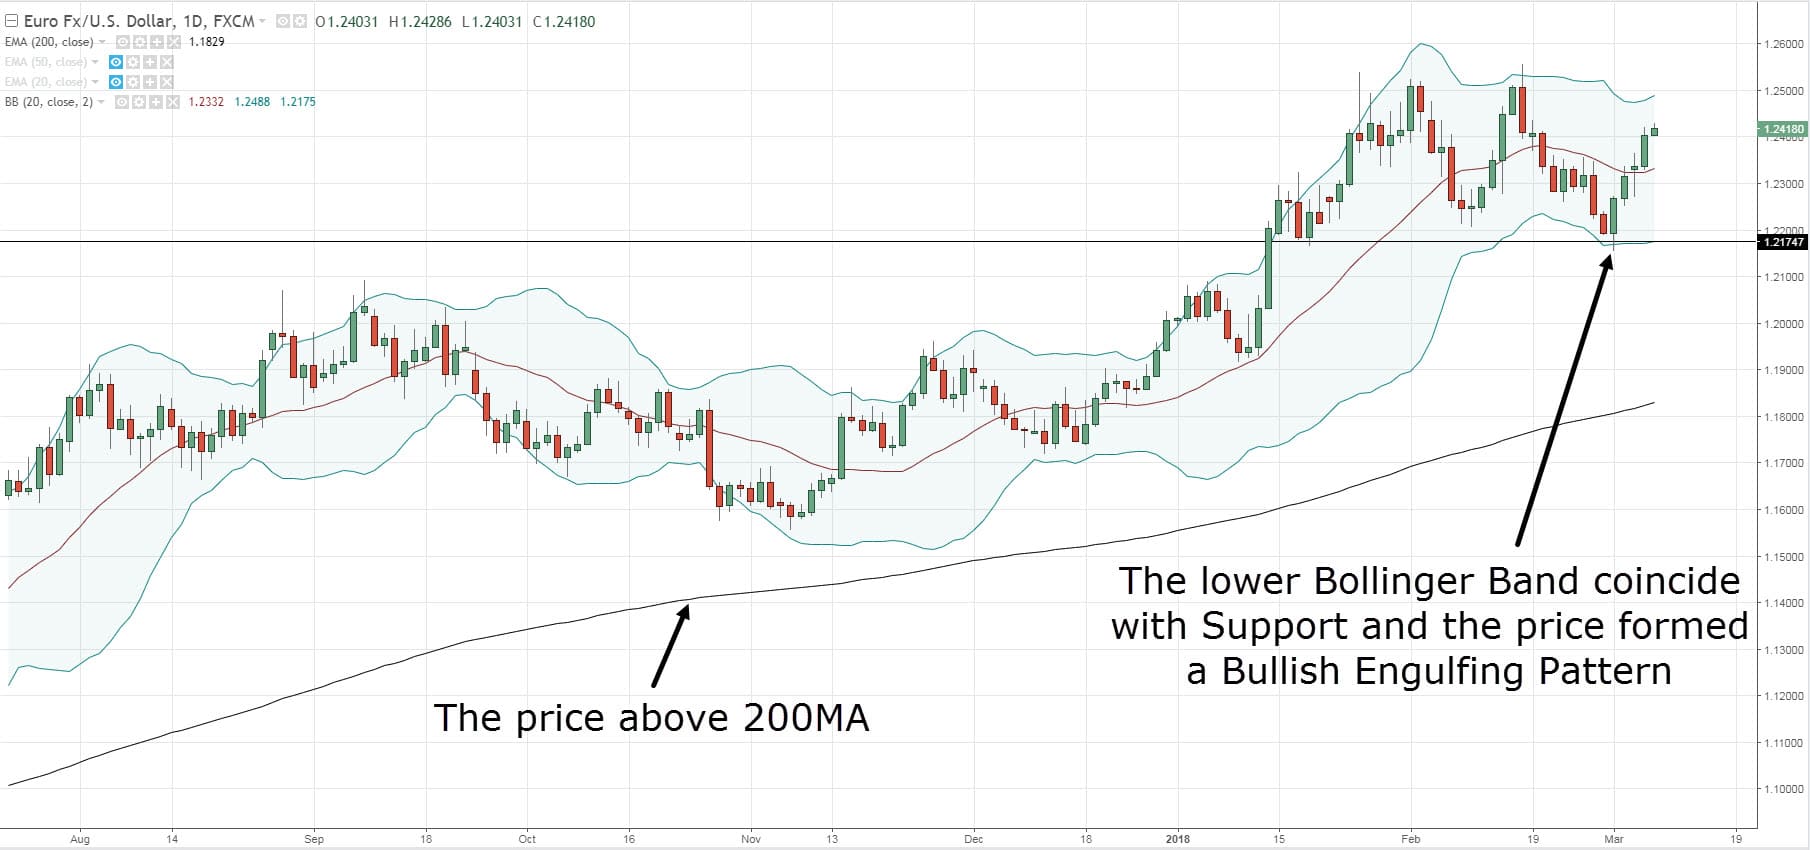
- Look to long the lower band in an uptrend (and vice versa)
- Reversal candlestick patterns that show signs of reversal
- The outer bands coincide with Support and Resistance
Here’s an example:
The price on EUR/USD is at the lower Bollinger Band that coincides with Support, and it formed Bullish Engulfing pattern.
Pro Tip: You can adjust your Bollinger Bands settings to 3 standard deviation (or higher) to identify even more overbought/oversold levels to trade off.
Moving on…
Bollinger Bands Squeeze: How to identify explosive breakout trades about to occur
Here’s a fact:
Volatility is always changing.
The markets move from a period of high volatility to low volatility (and vice versa).
If you’re a new trader, it can be difficult to identify the volatility of the markets.
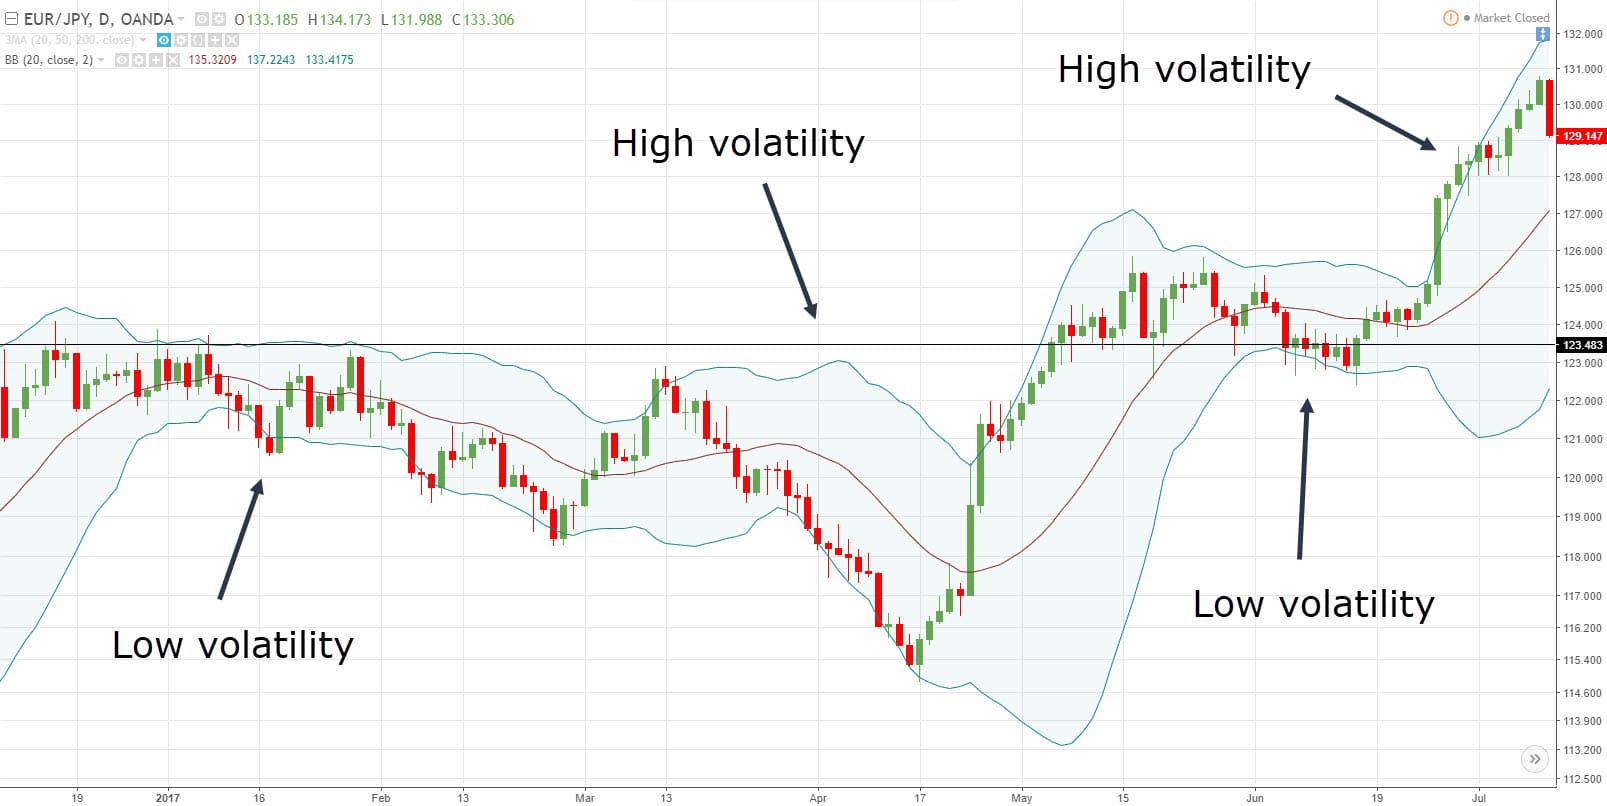
So, this is where Bollinger Bands can help because it contracts when volatility is low and expands when volatility is high.
Here’s an example:
So, the question is…
How do you use Bollinger Bands to anticipate a possible breakout?
Simple.
You look for the Bollinger Bands to contract (or squeeze) because it tells you the market is in a low volatility environment.
Why?
Because volatility tends to expand after contraction!
An example: Before the breakdown, Crude Oil is in a low volatility environment (as shown by the contraction of the bands).
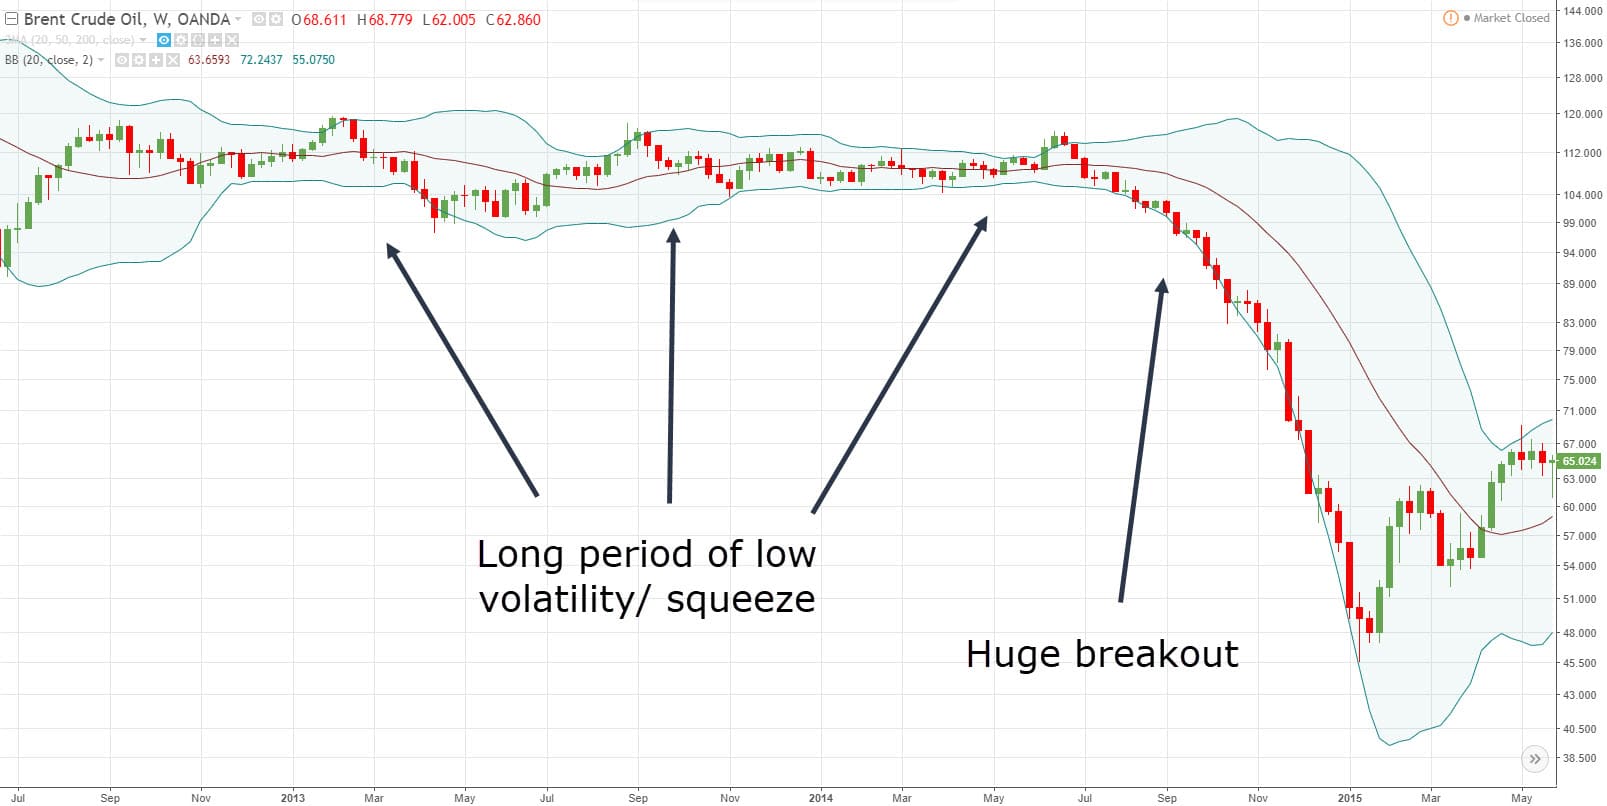
Pro Tip: The longer the volatility contraction, the stronger the subsequent breakout will be.
How to identify the direction of the breakout
Now…
Although Bollinger Bands can alert you to potential breakout trades, it doesn’t tell you the direction of the breakout.
However, you don’t need to be Einstein to figure out where the market is likely to go.
Because all you need to do is look at the trend.
Look at the chart below:
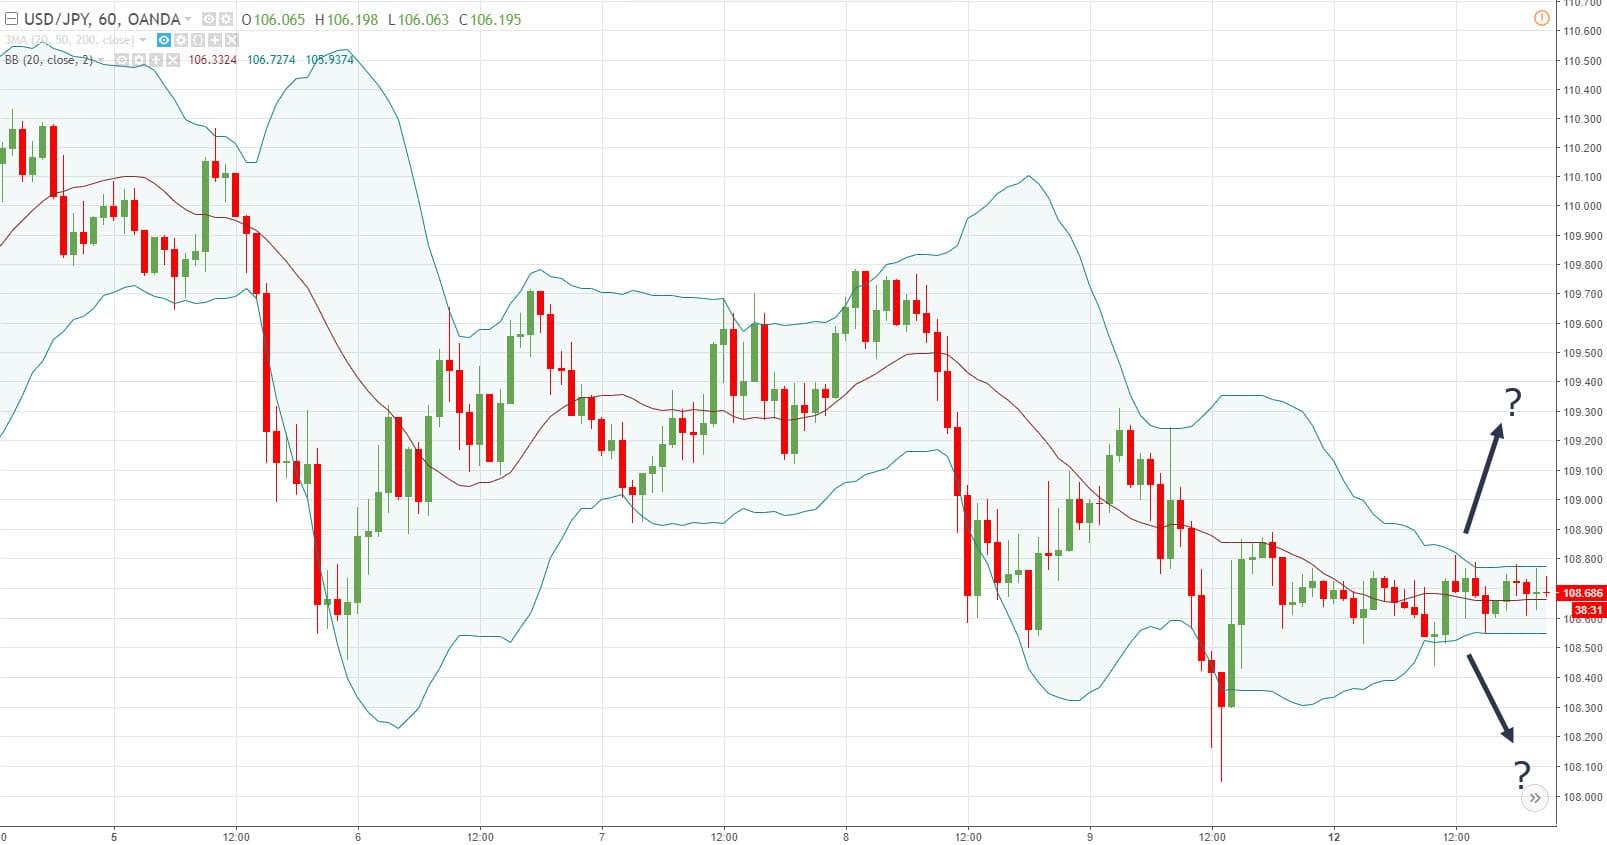
Where do you think the market is likely to breakout, higher or lower?
Probably lower because the trend is down.
And you’re right because the market broke down lower (yes I cherry-picked this chart)…
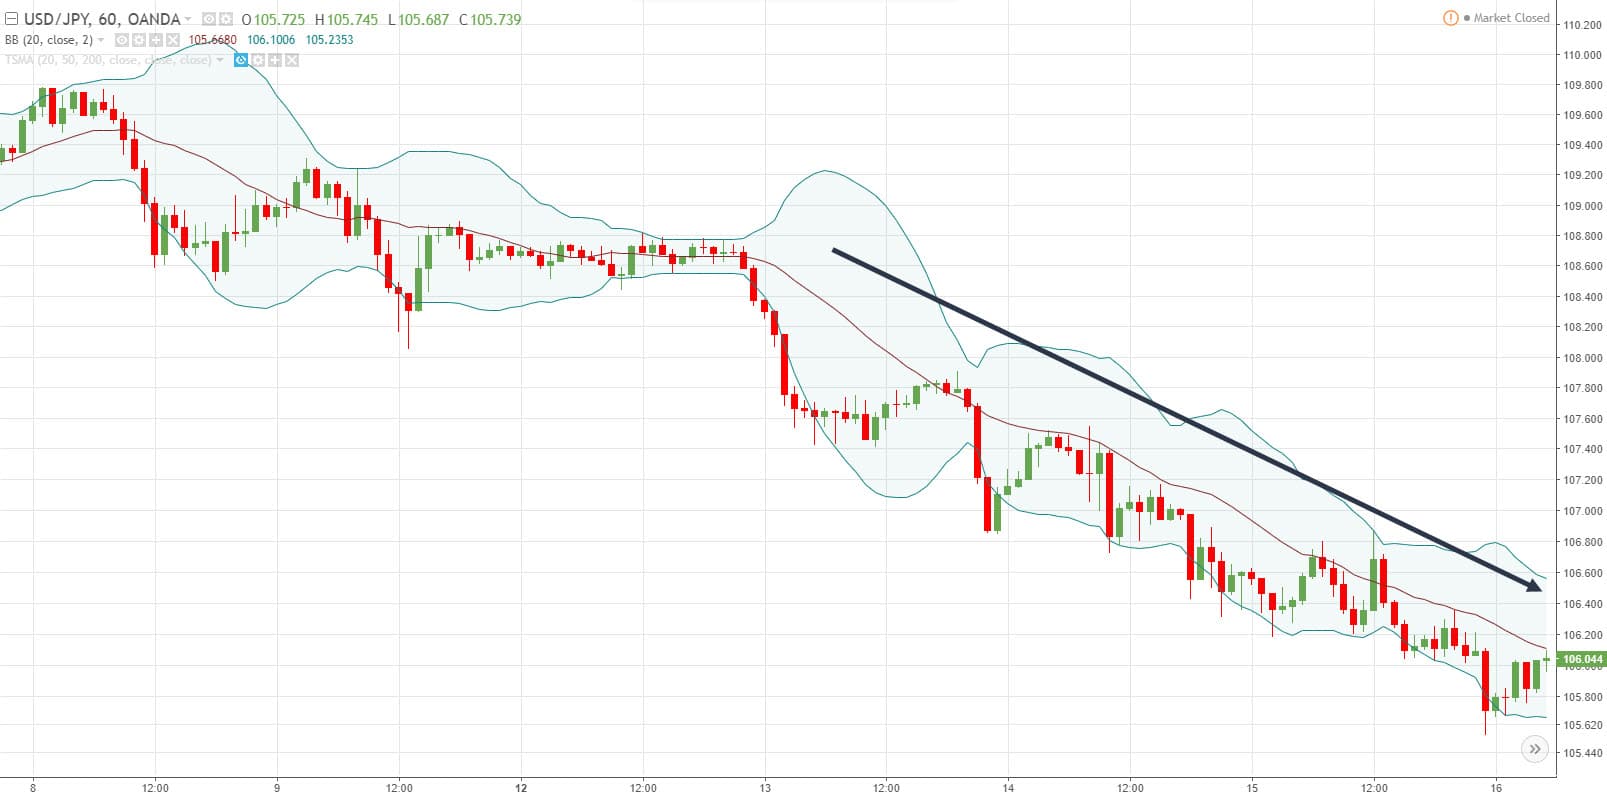
Simple yet powerful, right?
How to trade with the trend using Bollinger bands
Here’s the deal:
You know the middle line of the Bollinger Bands is simply a 20-period moving average (otherwise known as the mean of the Bollinger Bands).
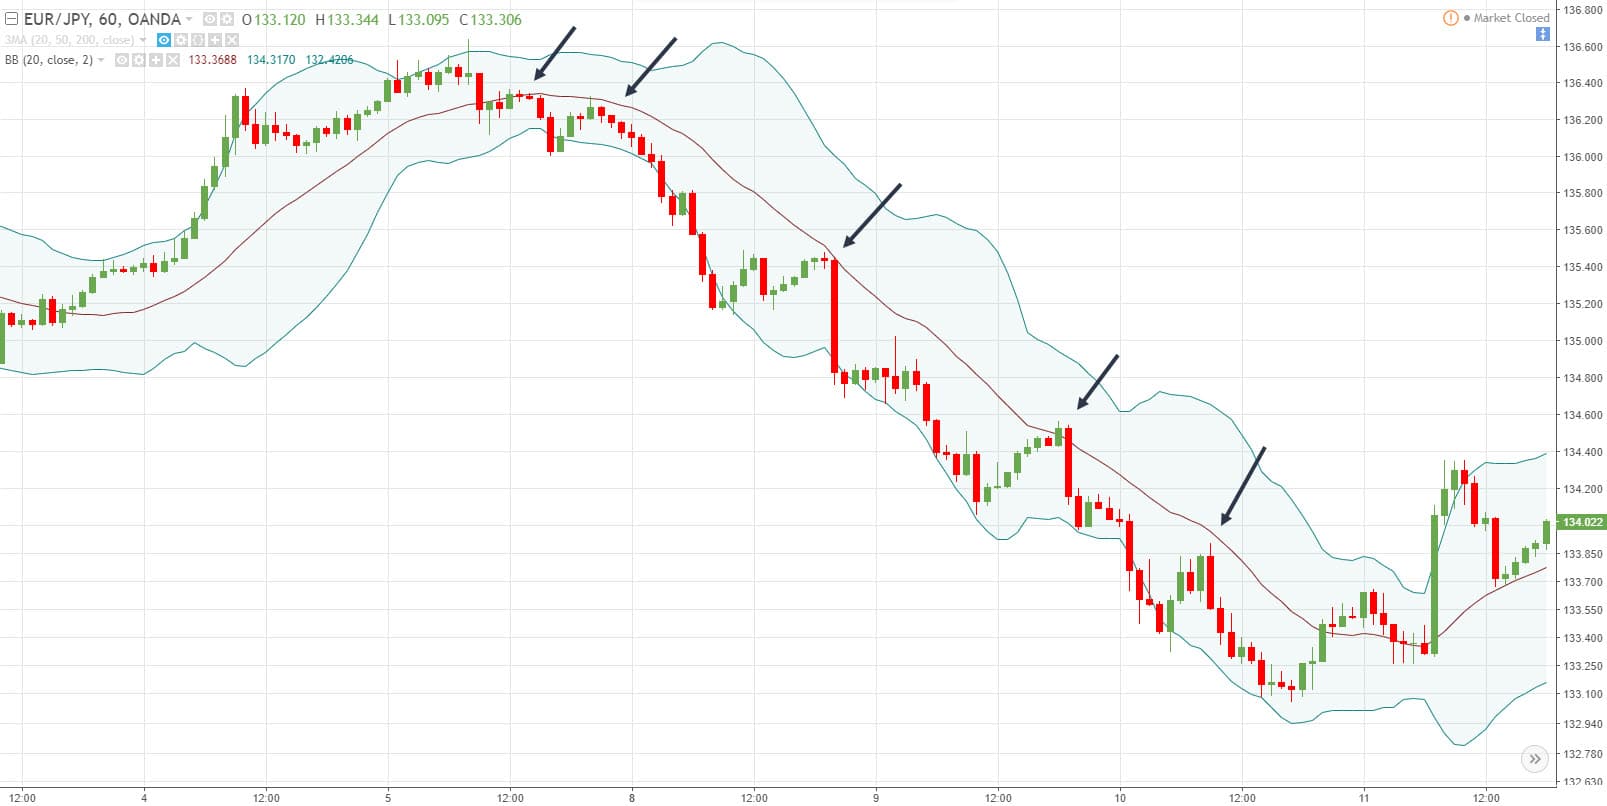
And in strong trending markets, the 20-period moving average can act as an “area of value”.
This means when the market pullback towards the 20 MA, it’s an opportunity for you to get long (or short).
An example: The price bouncing off the 20-period moving average and it offers shorting opportunities…
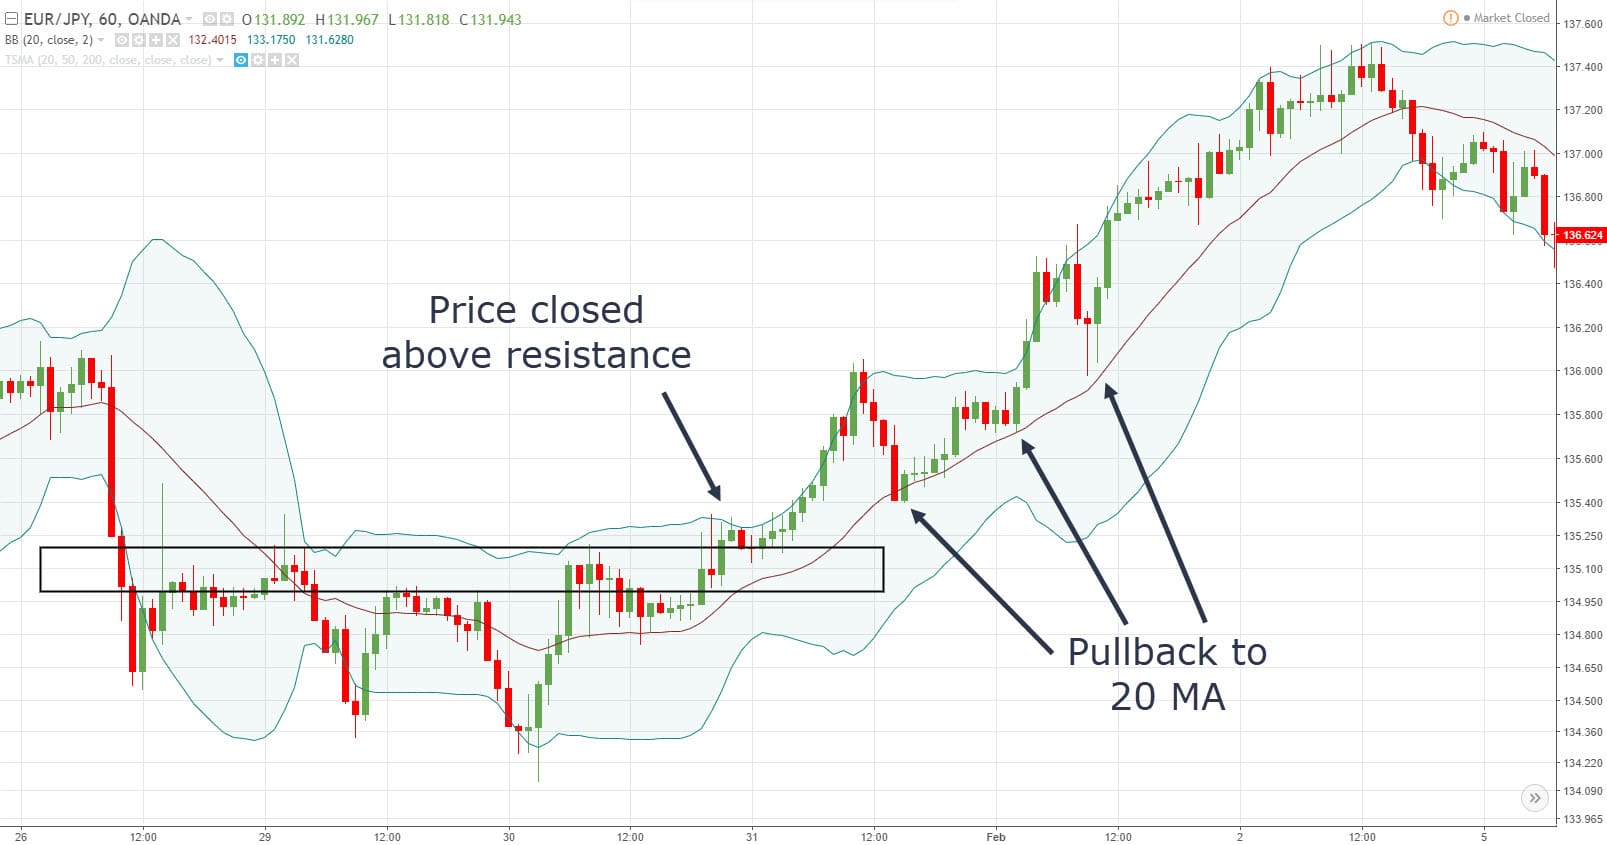
Here’s another example:
Pro Tip: If you want to ride the trend, you can trail your stop-loss using the 20 MA, or the outer Bollinger Bands.
The Bollinger Bands and RSI Combo (a little-known technique)
Here’s the thing:
The Bollinger Bands indicator is great for identifying areas of value on your chart.
But the problem is… it doesn’t tell you the strength or weakness behind the move.
For example: How do you tell if the market will continue to trade outside of the outer bands or mean revert?
That’s where the Relative Strength Index (RSI) indicator comes into play.
And what you’re looking for is a divergence on the RSI indicator.
You’re probably wondering:
“What is an RSI divergence?”
Well, it can go 2 ways…
- A bearish divergence is when the market makes a higher high, but the RSI indicator shows a lower high (a sign of weakness)
- A bullish divergence means is when the market makes a lower low, but the RSI indicator shows a higher low (a sign of strength)
So, now the question is…
“How do you combine RSI divergence with Bollinger Bands?”
Here’s how:
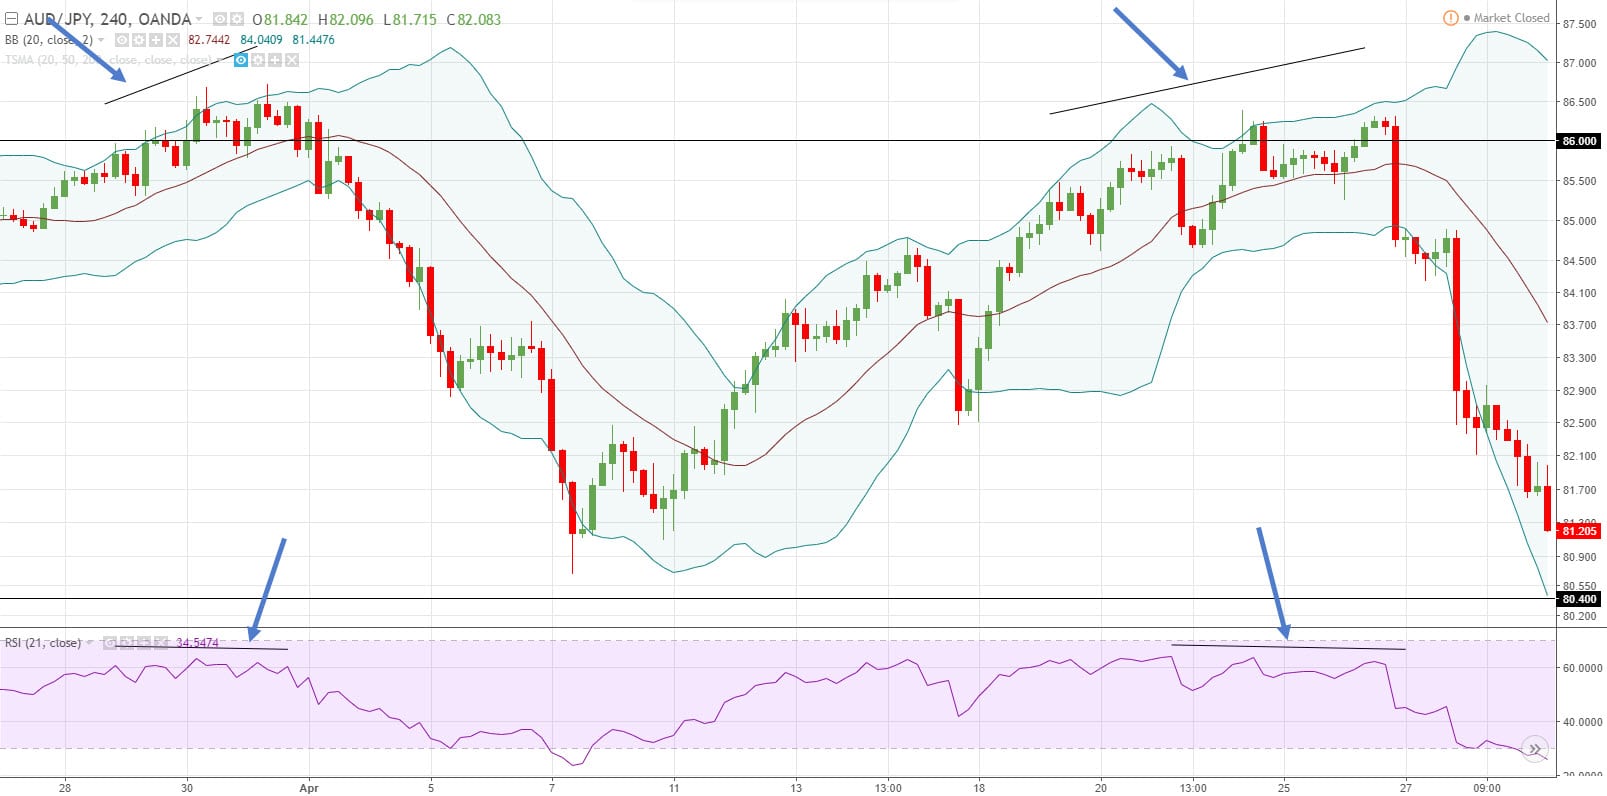
If the price is at upper Bollinger Bands, then you can look for a bearish RSI divergence to indicate weakness in the underlying move.
Or…
If the price is at lower Bollinger Bands, then you can look for bullish RSI divergence to indicate strength in the underlying move.
Here’s an example:
Pro Tip: You can combine this technique with Support and Resistance to find high probability reversal trades.
The Rubber Band effect: How to use Bollinger Bands and “predict” market reversal
Now:
You can think of Bollinger Bands like a rubber band.
Whenever the price gets too far away from it, it tends to mean revert back towards the middle band.
You’re probably thinking…
“But how do you know when it’s about to snap back? Because the price can stay overstretched for a long time.”
You’re absolutely right.
That’s why you must also take into consideration Bollinger Bands, Support Resistance, and Candlestick patterns.
Here’s how it works…
(For long setups)
- Look for strong momentum into Support
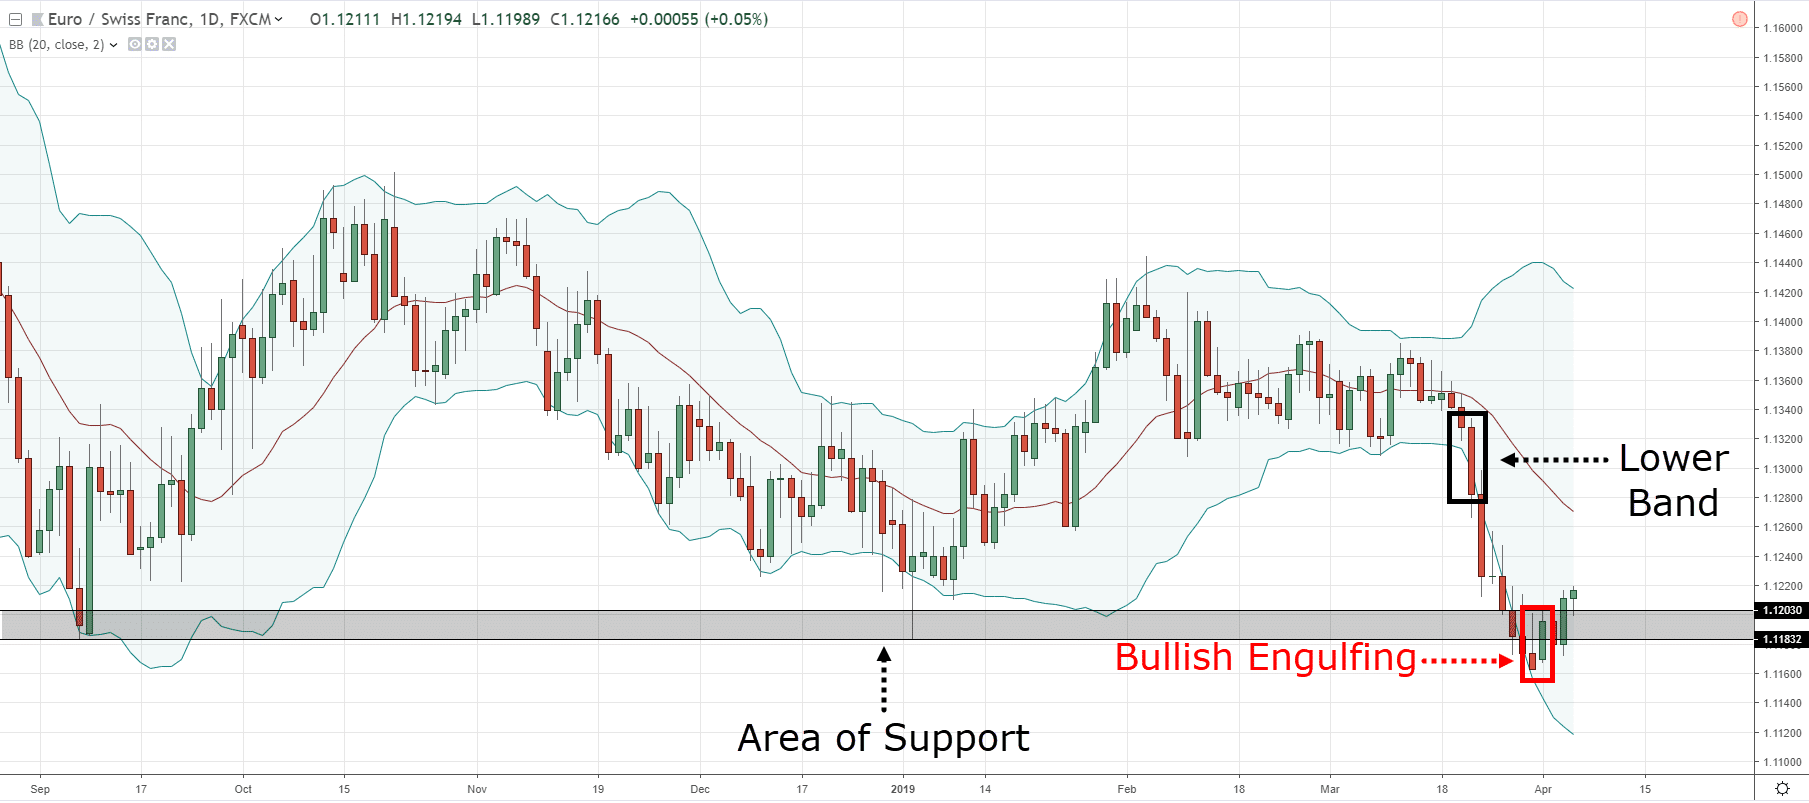
- You want to see the candle close outside the lower Bollinger Bands (this tells you the market is overstretched)
- If the next candle is a bullish reversal pattern (like Hammer, Bullish Engulfing, etc.), then the market is likely to reverse higher
- And vice versa for short setups
Here’s what I mean…
Price bounced from Support at EUR/CHF Daily:
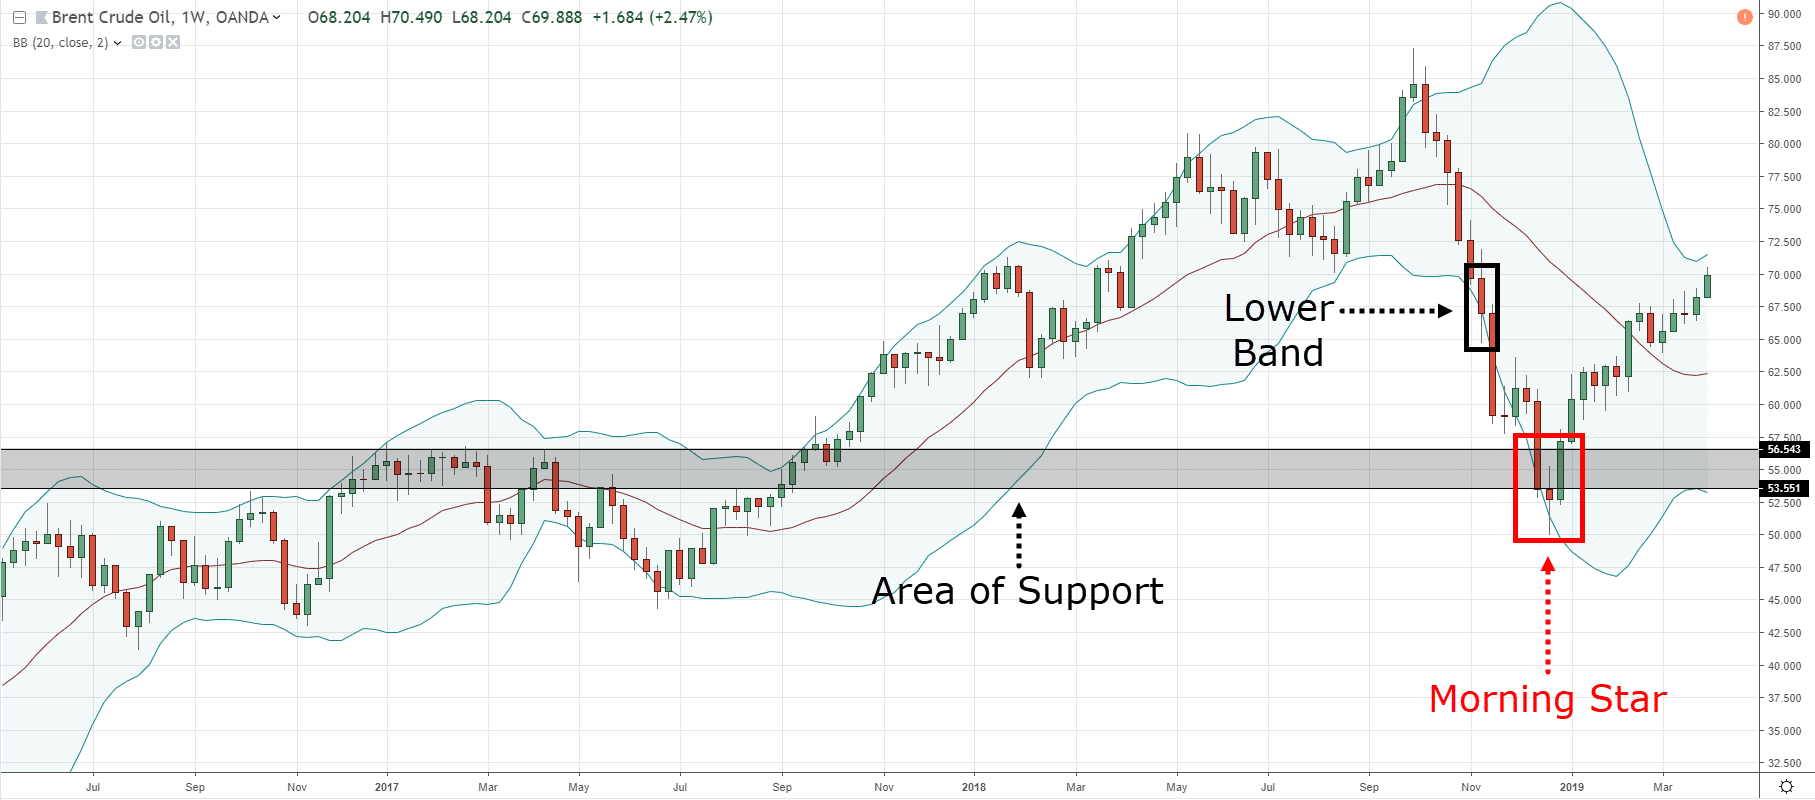
Price bounced from Support at Brent Crude Oil Weekly:
Pro Tip:
By default, the outer bands are 2 standard deviations away from the middle band (20MA).
If you want to identify even more overstretch market conditions, you can increase the standard deviation to 3 or more.
Conclusion
Here’s what you’ve learned today:
- The Bollinger Bands indicator can help you identify when the market is “cheap” or “expensive”
- In an uptrend, you can long near the lower Bollinger Band
- In a downtrend, you can short near the upper Bollinger Band
- When the Bollinger Bands is in a squeeze, it signals the market is “ready” to breakout
- You can use the 20-period moving average to time your entries in trending market
- You can use Bollinger Bands and RSI divergence to find high probability reversal trades
- You can use Bollinger Bands and Support and Resistance to “predict” market reversal
Now, here’s what I would like to know…
How do you use the Bollinger Bands trading indicator?
Let me know your thoughts in the comments section below.
Fonte: https://www.tradingwithrayner.com/bollinger-bands-trading-strategy/